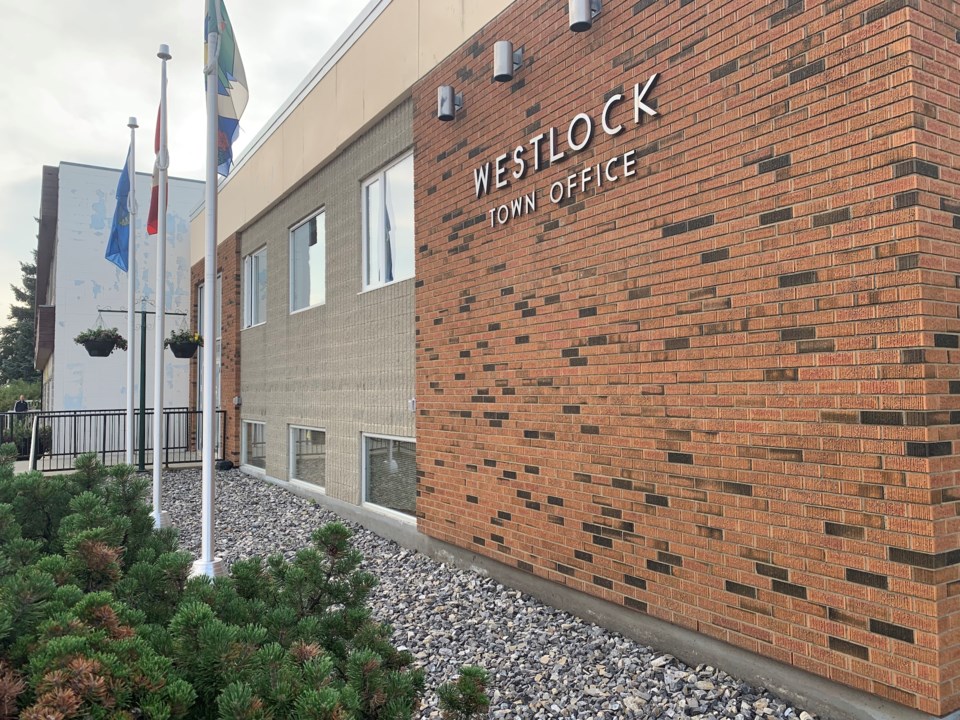
The town of Westlock has compiled their 2025 Socio-Economic Benchmark report which tracked Westlock’s general population and economic growth over the past 25 years as part of the town’s Comprehensive Economic Development Strategy (CEDS).
The report was presented to Westlock Town Council by Director of Planning and Development Danielle Pougher July 14.
“It's a really good resource to have for when we're trying to plan new initiatives and justify them,” said Pougher. “These reports are also really handy to have when we're making grant applications and we need to back up our claims. They’re also really good for potential investors because they can look at this and see our data very succinctly in the trends that we're seeing and forecasting.”
The report tracked data from the Town of Westlock going back to 2000 and noted a general trend of slow but steady growth with several fluctuations due to extenuating circumstances.
Westlock experienced general population growth from 4,920 residents in 2001 to 5,239 residents in 2024 (6.5 per cent). The population fluctuated with a decline from 2008-2011, possibly due to the global economic recession, and declined again from 2015-2021, but recent data from 2023 and 2024 suggests slow and steady growth.
The report also suggests an aging population in Westlock, with the community recording a 30 per cent increase in deaths since 2001 and a declining birth rate. The town has also seen a sharp drop in recorded marriages with 54 in 2001 dropping to only three in 2021 (possibly due to Covid) but rebounding to 19 in 2023.
“Ensuring the community remains affordable and that we have all the services that (a younger population) would desire here would be crucial for retention,” said Pougher. “There's also tactics we could look at in terms of creating post-secondary opportunities so they can stay here while they're pursuing higher education as that tends to be one of the main draws for younger adults moving out of the community.”
Westlock has also seen a steady growth of visible minorities in the community with only three per cent identifying as visible minorities in 2001, rising to 9.4 per cent in 2021 in line with larger national trends of diversification and immigration. The town also saw their Indigenous population grow in the same period from 3.1 per cent to 9.9 per cent.
The median income for all families in Westlock grew from $71,380 in 2011 to $85,550 in 2021,van increase of 19.85 per cent. Average median income in Westlock also more than doubled over the past two decades. The largest percentage median income growth rate was experienced by lone-parent families, going from $22,800 in 2000 to $51,500 in 2021 (125.7 per cent). Lone-parent families still earn considerably less than couple families ($93,060 median income).
Westlock experienced an increase in overall educational attainment from 2001-2021 with the number of people with high school completion rising from 385 to 1,360, the number of people with college or non-university education rising from 405 to 645 and number of university degree holders rising from 285 to 455. Despite the increase in education, the overall number of trades certifications/apprenticeships declined from 525 in 2001 to 410 in 2021.
Westlock’s growth was compared to other communities with similar population and economic conditions in the report.
Westlock’s overall population growth (6.5 per cent) was less than several of the other comparable communities including Morinville (10 per cent), Taber (9 per cent) and High Level (8 per cent) but was greater than other communities including Drayton Valley (3 per cent), Barrhead (-3 per cent), Vegreville (-1 per cent), Rocky Mountain House (-7 per cent) and Fairview (-11 per cent).
Westlock’s median family income growth (19.85 per cent) from 2011-2021 was less than Taber (29.15 per cent), Didsbury (22.91 per cent) and High Level (22.43 per cent) and the median family income ($85,550) is less than Morinville ($116,100) and Drayton Valley ($109,640).
Westlock’s housing growth of 298 new dwellings (14.96 per cent) from 2001-2023 was also less than several other communities including Morinville (87.3 per cent), Drayton Valley (41.7 per cent), High Level (38.4 per cent), Fairview (25.5 per cent) and Rocky Mountain House (24.6 per cent).
The next stage of the CEDS plans to conduct think tank sessions with the public to determine larger economic goals and the community’s vision for the town.
“We’ve heard from business owners as well as other stakeholders that there is a need for the community to grow or at least replace our aging population as we get that demographic shift,” said Pougher. “Regardless, there will be a need to attract new residents to at least keep our population stable.”


