The average Canadian household saw a slight increase in savings in 2023 compared to the previous year, but the majority of Canadians now have negative net savings.
These two seemingly contradictory statements come from the latest Statistics Canada data on national income distribution, which details the growing wealth disparity in the country.
While there was a modest increase in the overall net savings if all Canadian households are taken together, this statistical bump is due to sizable gains made by the country's wealthiest.
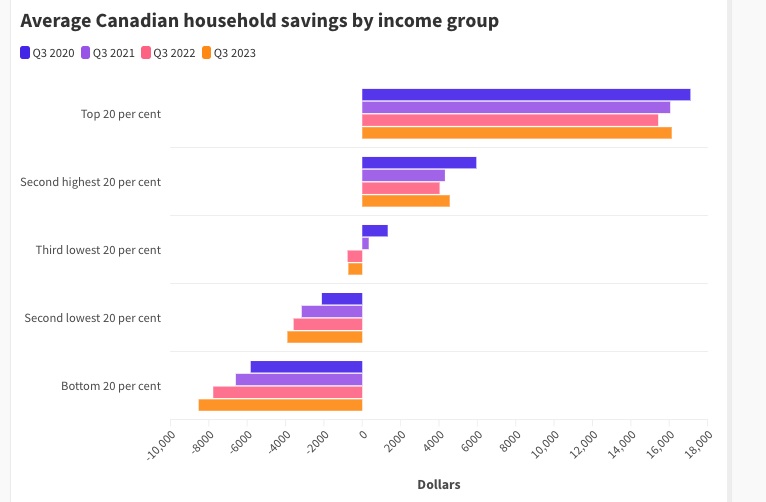
The highest income 20 per cent of Canadian households saw a 4.6 per cent increase in savings, thanks in part to gains of 5.7 per cent in wages and nearly 10 per cent in investment income. This richest fifth of households now account for more than two-thirds of net worth, the StatCan report says.
And the income inequality between those at the top and the rest of Canadians also continues to widen. The gap in the share of disposable income between the two highest income groups and the two lowest grew by 0.5 per cent from 2022, and now sits at 44.9 per cent.

"While higher interest rates can lead to increased borrowing costs for households, they can also lead to higher yields on saving and investment accounts," the report says. "The lowest income households are more likely to have a limited capacity to take advantage of these higher returns, as on average they have fewer resources available for saving and investment."
For the second year in a row, the bottom 60 per cent of households had more debt than savings. For the lowest income group in StatCan's report, the average household has $8,527 more debt than savings.
"For the lowest income households, cost-of-living increases outpaced income gains, especially for transportation, health, and housing," the report says.
For many people, the debt-to-income ratio also continues to increase. For working-age households, those between the ages of 35 and 64, the debt-to-income ratio ranged from 164 per cent to 255 per cent, as of the third quarter of 2023. This debt ratio also increased by about six per cent for this demographic, compared to the year before.
For the youngest households, those under 35, the debt-to-income ratio has actually declined by over 10 per cent, and dipped slightly for seniors as well. Though the youngest households are holding less debt, they are paying more to service those debts because of high interest rates.